News
Online presentation on design and execution of EQUIMOB online survey
Prajwal Nagesh, PhD scholar with the EQUIMOB project was invited to share experiences of designing the project’s online survey. The presentation was organised on 17 November 2020, as part of the Advanced Methods and Techniques for the Course International Development Studies at Utrecht University. The use of methods such as online survey has seen renewed interest amidst the new norm of physical distancing. The talk was aimed to provide students with insights from the recently concluded EQUIMOB’s COVID-19 online survey.
The presentation entailed anecdotes of some of the dilemmas faced, choices made and what worked and what did not work in designing the survey. The talk emphasised the importance of having a structure for the survey and placing the participant’s experience (in this case, older adults) central to its design. The necessary attention to details required in maintaining a user-friendly interface for the survey form was explained. For example, all hyperlinks on the way to the survey form were removed to avoid any possible confusions to participants. Similarly, another example was limiting the number of options listed in the columns so that participants need not scroll horizontally to access these options on the phone. It was explained, how all the decisions such as the design of the interface, structure of the survey, choice of language used and instructions to participants were all guided through the lens of a prospective participant (older adult).
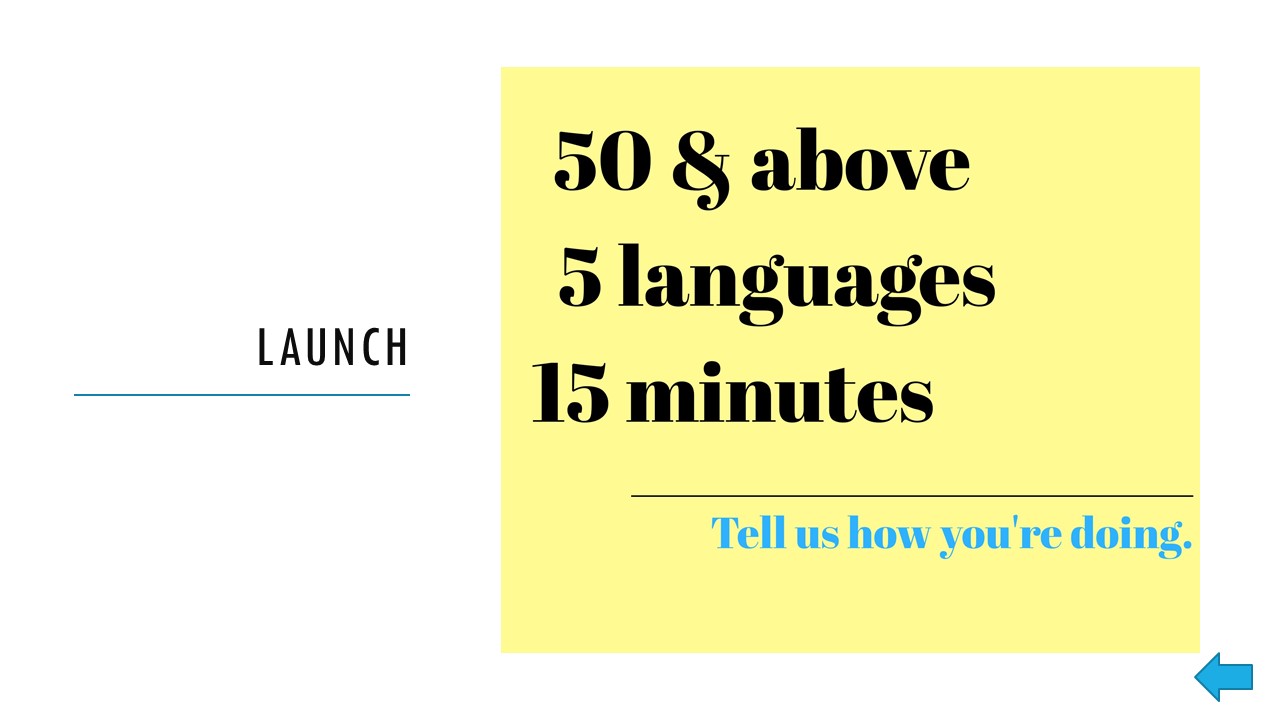
Image: Screenshot from the presentation
While designing the survey was a challenge, the dissemination of the survey was a crucial and challenging phase. The need to disseminate the survey on appropriate platforms, forums, and stakeholder organisations to reach the target audience was stressed. The raw data across different stages – downloaded data, translated data and coded data were visually presented to students. In the end, an infographic designed based on the descriptive analysis of the survey data was shared.
The brief presentation was followed by a question and answer session. Some of the interesting questions were on the possibility of accessibility bias across different economic class? Why qualitative questions were not included? If the instruction videos could have any influence on the choices of users? What were the complexities of disseminating the survey? The discussion that followed was an adequate treatment of the online survey as a research method, its limitations, and complexities.